
Turning spatial data into decisions.
I'm Arhum Aziz, a Geography student at the University of Waterloo specializing in Aviation, with hands on GIS and survey experience building spatial systems for municipal infrastructure. I'm looking to bring that background into aviation planning, GIS analysis, or spatial planning roles more broadly.
My work takes flight beyond the sky, driven by dedication that knows no limits.
Every plan starts with people on the ground agreeing on where things go, right down to the tunnels underneath the terminal.
I love turning raw spatial data into decisions people can act on. As a Geography student at the University of Waterloo specializing in Aviation, I've built that instinct through coursework in GIS, geodesy and surveying, and aviation fundamentals, and I'm always looking for the next real problem to map out.
That energy carried straight into my work as a Technical Analyst with the Region of Peel, where I built internal GIS applications and led the migration of over 1,000 infrastructure records into a centralized geodatabase, and into independent work like a flood susceptibility model for the Montgomery Creek Watershed, built entirely as a weighted-overlay workflow in ArcGIS ModelBuilder. I'm excited to bring that same spatial thinking to aviation planning, GIS analysis, or any team that needs someone who can turn maps into decisions.
Skills
GIS & Spatial Analysis
ArcGIS, QGIS, ModelBuilder, FieldMaps, FME
Survey & Aviation
Geodesy and surveying, total station, dGPS, AVIA 100 coursework
Data & Programming
Python, R, SQL, Java, PostgreSQL
Reporting & Comms
Power BI, Canva, Microsoft 365, stakeholder dashboards
Experience
Flight logMarketing Coordinator
Elegant Closets, Ajax ONOverhauled CRM data for 2,000+ customers and rebuilt website copy around SEO intent, lifting organic traffic 40% and cutting response time 35%.
Technical Analyst
Region of Peel, Brampton ONLed development of internal GIS applications and a centralized asset geodatabase. See Selected Projects below.
Founder
TechTurbo, Pickering ONFounded a technology consulting firm, securing a $3,000 grant and growing client engagement 80% through targeted marketing and custom system builds.
Selected projects
GIS & spatial planningInfrastructure Spatial Planning Project
GEOG 310 · New Waterloo Hospital site, Bearinger Road and Hagey BoulevardFor GEOG 310, I planned the land survey and site layout for a proposed hospital on University of Waterloo owned land, close enough to become the university's nearest hospital. The plan covers three surveys: a closed traverse boundary survey anchored to monuments and baselines, a total station radial survey of the emergency, in patient, and administration buildings, and an RTK GNSS survey of the roads, parking, and utility corridors, cross checked against photogrammetric elevation data.
Real constraints shaped the plan. A stand of trees along the southeast boundary reduces GNSS signal quality, so that stretch relies on total station measurements instead. A cluster of rocks near the site centre had to be avoided when placing building footprints. The layout puts emergency and ICU next to the main access road for ambulance response, parking near maternity care to shorten walks for patients, and administration off to the west near the wooded area, with multiple road connections to Westmount, Bearinger, and Hagey.
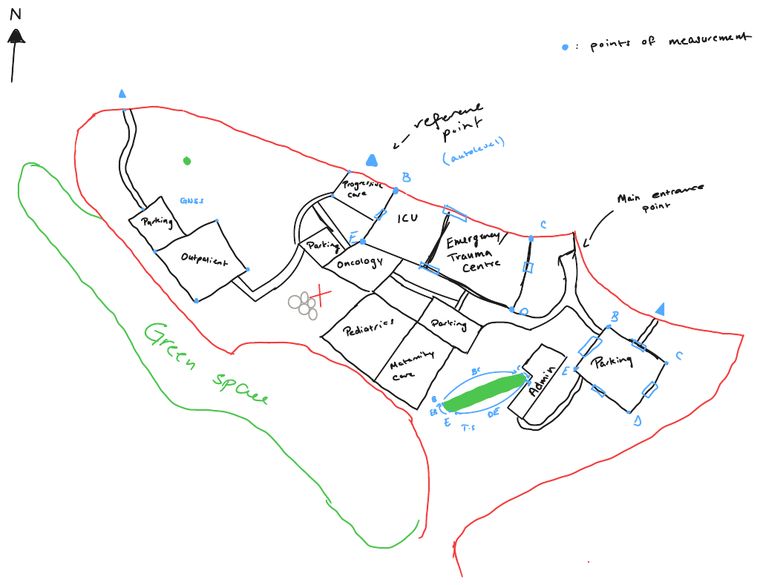 Concept sketch: department layout and reference points
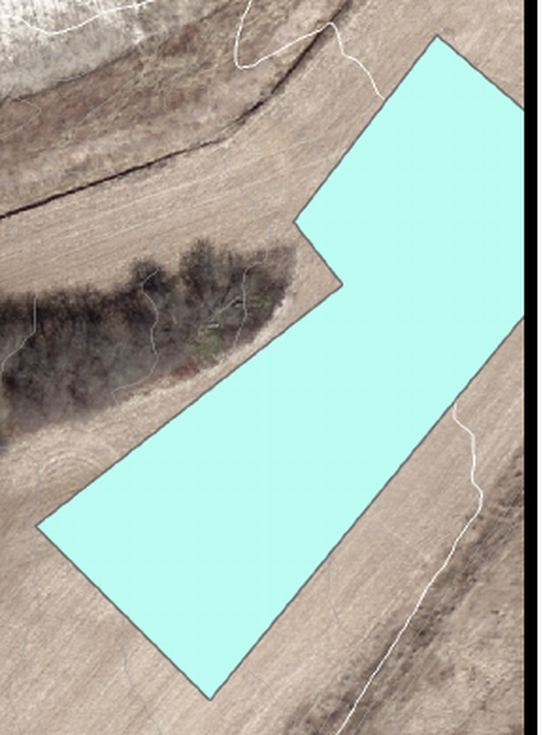 Constraint analysis: tree cover affecting GNSS accuracy
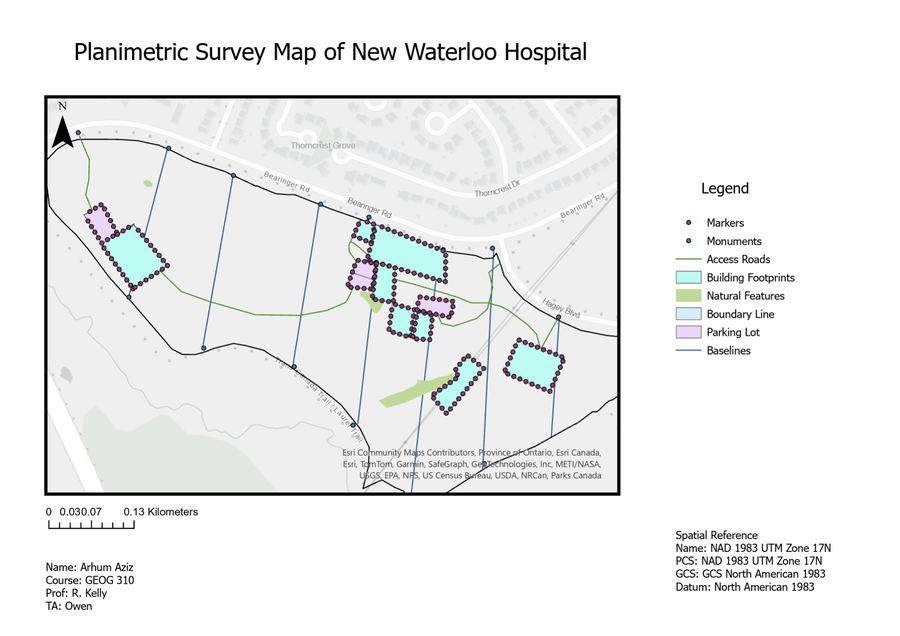 Final planimetric survey map, GEOG 310
Internal GIS Field Applications
Directed development of two internal GIS applications for Region of Peel field crews, built in Survey123 Connect and ArcGIS to replace error-prone paper inspection forms with guided digital data capture, cutting processing time by 60% and giving supervisors a live view of field status instead of a stack of forms waiting to be typed up.
Flood Susceptibility Mapping, Montgomery Creek Watershed
Independent GIS project · Hydrology & risk modelingFlooding near urban creek corridors is chronically underreported: a documented flood can depress nearby property values, so homeowners often have every incentive to stay quiet about basement or yard flooding. That leaves municipalities and emergency response crews working blind, without the ground-truth data they would need to know where to show up first when a storm hits.
To close that gap, I built a flood susceptibility model for the Montgomery Creek Watershed that does not depend on anyone reporting anything. The entire analysis runs as a single reusable geoprocessing workflow in ArcGIS ModelBuilder, chaining ten input branches, elevation and slope derived from a shared DEM, parcel centroids, and Euclidean distance surfaces to buildings, catch basins, parking lots, park boundaries, sidewalks, trails, and tree cover, each clipped to the watershed boundary and reclassified onto a shared risk scale before being combined through a weighted sum. The result is a continuous susceptibility surface that flags hotspot parcels concentrated along the creek corridor and low-lying elevation bands, giving planners and response crews a proactive map of where flooding is most likely to hit hardest, whether or not it is ever called in.
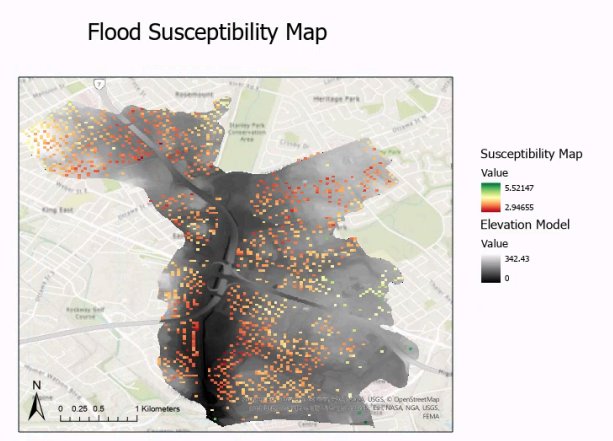 Susceptibility surface: hotspot parcels over the elevation base layer
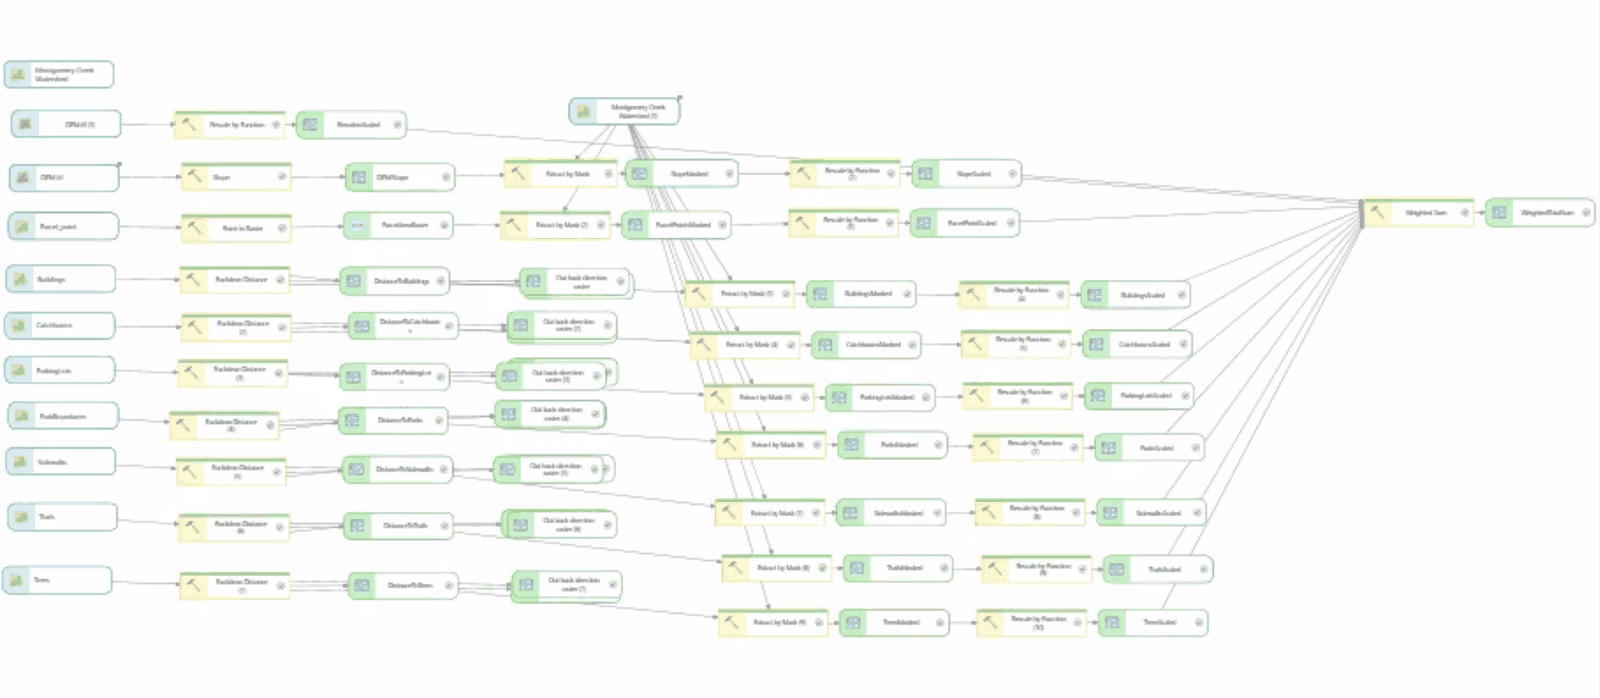 The full geoprocessing model: every input reclassified and chained into one weighted-sum output
Let's talk about aviation planning.
Currently a Geography student at the University of Waterloo specializing in Aviation, looking for GIS analyst, spatial planning, or airport infrastructure opportunities across the sector.
a5aziz@uwaterloo.ca